Performance Testing With Locust

Introduction

Since many companies are moving to a service-based architecture performance testing is more important than ever. There are many tools out there such as JMeter, Gatling, Postman or any of the dozens of applications you can buy. I’m going to focus on Locust for a few reasons:

  1. It’s free and open source
  2. It’s quick and easy to get up and running with some basic tests
  3. Even if you don’t know Python it’s easy to pick up and run with its web-based UI
  4. It’s scalable – it supports simulating anywhere from one to thousands of users on a single thread

Setup

Getting Locust setup is very straight forward. The most difficult decision is actually deciding which version of Python to use as it supports 2.7, 3.3, 3.4, 3.5, and 3.6. I’m going to go with 3.6 since I already have that installed. If you aren’t sure which version to use I would recommend 3.6 as it’s the latest and is currently under active development. If you’re wondering about the differences between 2.7 and 3.x there’s a good write-up on the Python website. Personally, I don’t like Python’s decision to split the user base but for our purposes here you can use any version.

  1. The first thing you’ll want to do is download Python
  2. Second installing Python is as easy as running
    pip install locustio

    . If this doesn’t work verify that Python is in your environmental variables (on Windows) and opening a new command window. If that still doesn’t work following the instructions here should get you started.

  3. That’s it, you’re ready to go!

Basic Locust Scripting

After installation you’re ready to start scripting. I like to use Visual Studio code but any other editor like Sublime should be just fine.

Here are the basic components of a Locust script:

  1. Tasks – represent an action to be performed, chosen at random by Locust
  2. TaskSet – a class that defines the set of tasks to be executed
  3. HttpLocust – a class that represents the user and is “hatched” to test the system. The behavior of the user is defined by the task_set attribute, which points to a TaskSet class.

These are all of the things you need in order to setup a very simple test. More in-depth documentation about the API’s features can be found here.

Here’s a basic script that will hit a webpage and record the response time of the page:

from locust import HttpLocust, TaskSet, task

class UserBehavior(TaskSet):
    @task(1)
    def profile(self):
        self.client.get("/")

class WebsiteUser(HttpLocust):
    task_set = UserBehavior
    host = "http://google.com"
    min_wait = 5000
    max_wait = 9000

To start the Locust server use the command locust -f (script path/name) and then hit the URL localhost:8089 in your browser to access the UI. From here you can start the script and view the results.

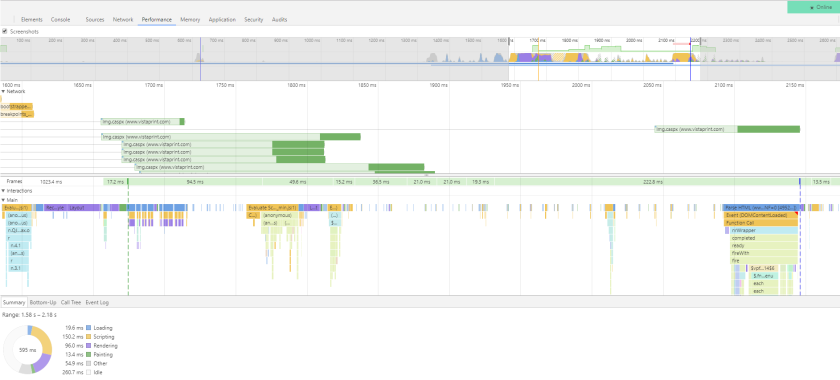
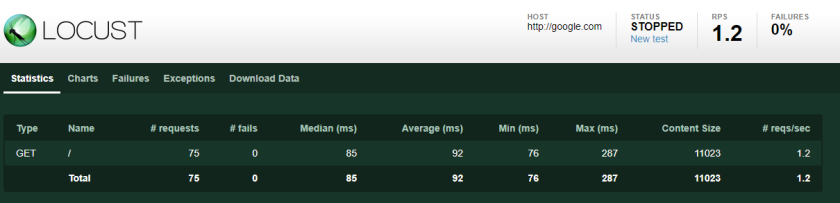
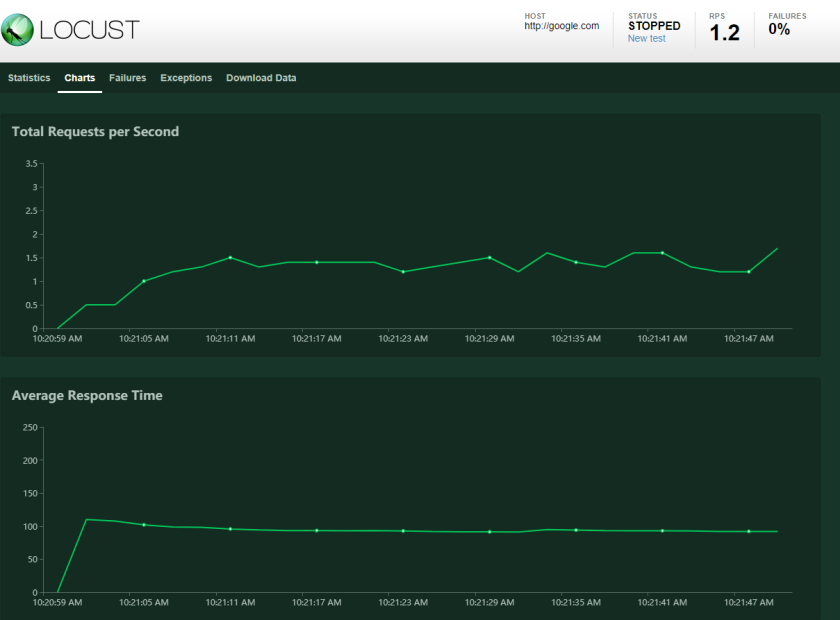
While the script is running you have access to the real-time data via a few different views.

Stats view:

locust stats view

Charts view:

locust charts view

By default the data is not saved to a file, but if you follow the instructions here you can enable that feature. There are a few different ways that you could do this.

Extending the Example

In order to test something useful let’s extend the example to test several pages at one time (we could also test APIs or anything else), output the results to a CSV.

locust -f Example.py --csv=resultFile

Here I’ve added some additional URLs and added a custom response validator for a URL that doesn’t exist (just as an example). You can do plenty of other things in Locust such as validate response data, headers, etc.

from locust import HttpLocust, TaskSet, task

class UserBehavior(TaskSet):
    @task(2)
    def homepage(self):
        self.client.get("/")

    @task(1)
    def about(self):
        self.client.get("/intl/en/about")

    @task(1)
    def expect404(self):
        with self.client.get("/fakeurl", catch_response=True) as response:
            if response.content != "Success":
                response.success()

class WebsiteUser(HttpLocust):
    task_set = UserBehavior
    host = "http://google.com"
    min_wait = 5000
    max_wait = 9000

At this point, assuming you are doing some performance or load testing you can graph your results to find any anomalies. The easiest way to do this is to create a graph in Excel, but there are many other programs than graph data.

LocustResults

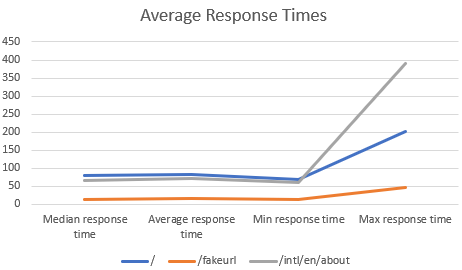
Here we have a graph of the median, average, min and max response times for each URL. Although this extended example is still simple it can be expanded to test nearly anything related to web requests. Locust itself is simple, powerful and easily extendable which is why I like it.

Selenium with Chromedriver

Despite Selenium being one of the most popular GUI automation frameworks I haven’t seen a lot of recent examples so I figured I would create some. Plus, I enjoy UI automation! If you are trying to get some Selenium tests off the ground the best way to get started is to start with a minimum set of features then build out from there.

First, if you want to use Selenium to test your website one question you should ask is, “is this the best tool for what I want to accomplish?” If you want to run an end-to-end verifications or integration test a specific UI feature Selenium may be for you. If you want to just test a service or some other non-UI component you may be better off using a framework at a different level.

Now that you’ve decided that Selenium is for you, the first step is to decide what driver to use. Chrome is the most popular browser these days and Chromedriver is kept fairly up-to-date so that’s what I like to use.

Getting Started

Installing Selenium, Chromedriver and a test runner (Nunit in this case) is easy, your packages.json might contain these items:

id="NUnit" version="3.8.1"
id="NUnit3TestAdapter" version="3.8.0"
id="Selenium.WebDriver"
id="Selenium.WebDriver.ChromeDriver"

The best way to setup a Selenium project is to use the principle of separation of responsibilities. You want your test file, framework setup, helpers, etc. to be different files that reference each other. That way you can easily add to your test repository while avoiding monolithic files that are difficult to maintain. It’s also important to setup an appropriate level of abstraction. Tests themselves should typically not use driver commands directly.

Let’s start with getting the driver up and running:

public class ChromeTestBase
    {
        public IWebDriver _driver;    

        [SetUp]
        public void ChromedriverSetup()
        {
            _driver = new ChromeDriver();
        }

        [TearDown]
        public void TestCleanup()
        {
            _driver.Quit();
        }
    }

There are many other features you could add here but if you just want the ability to launch a browser and run a simple test, this is good enough.

Utilities

Utility classes will make writing tests so much easier and cleaner. I highly recommend doing this for any common actions. This is also necessary if you’d like to maintain some layers of abstraction from the actual driver and your tests.

A basic utility could be for finding an element via XPath. This way, all you’ll need to do in your tests is call this with the right parameters instead of worrying about what your XPath looks like each time:

public static IWebElement FindElementByXpath(this IWebDriver driver, string tag, string attribute, string value)
        {
            return driver.FindElement(By.XPath($"//{tag}[contains(@{attribute},'{value}')]"));
        }

Another helpful utility is a class that contains constants like element classes or urls (or both):

public static string SigninPage= "/vp/sign-in.aspx"; public static string WebsiteBase = "http://www.vistaprint.com";

You can setup a utility class to do just about any repeatable task or contain any type of reusable data. If you plan on using something more than once, create this type of file.

Test Cases

Now that we’ve got our framework and utility classes setup we’re ready to test. With NUnit this is easy. All you need to do is create TestFixture class with some Test tags and NUnit will pick them up and run them. If you need more flexibility, like the ability to run command line arguments, maybe a console app is for you.

If you’ve written unit tests before, similar principles apply where each test should do the minimum required in order to test what needs to be tested. Additionally, if things need to be done before the actual tests can be run (eg: signing in) a utility class or method can be created to perform this repeatable step.

Here’s a very simple example that shows that a test doesn’t have to be complicated to add value:

[TestFixture]
    class Testcases : ChromeTestBase
    {
        [Test]
        public void ErrorMessageAppearsNoNavigation()
        {
            //Arrange
            _driver.NavigateTo(Urls.WebsiteBase + Urls.SigninPage);
            var startingUrl = _driver.Url;

            //Act
            _driver.FindElementByClass(PageElements.SignInButton).Click();

            //Assert
            Assert.AreEqual(startingUrl, _driver.Url);
        }
    }

This should be everything you need for a basic test setup. At this point you can build out the framework or continue to add tests.

Final Thoughts

If you currently don’t have any testing setting up Selenium can help you get some small but valuable tests. There are so many automation tools I just happen to have the most experience with Selenium C#. Selenium also supports many other languages so even if you are not familiar with C# chances are some other language you are familiar with is supported.

Google Chrome Puppeteer – Using the Trace Feature

One of the more interesting features of Puppeteer is the ability to record and access page trace information. This is especially useful if you are familiar with what this data is and what it can tell you. For others, the raw data may not be particularly interesting but there are tools out there that can help you analyze it.

First let’s get started setting up Puppeteer to record trace information:

await page.tracing.start({ path: 'trace.json' });
<page navigation>
await page.tracing.stop();

That should be it! Just a warning, these files can be fairly big depending on the page (the size of the file for my example below was 4 MB). In order to keep the size down and allow you to compare trace data across pages you may want to limit the size of each file to one page. This should be easy to do if you come up with a convention to differ the file names.

Here’s a full example of how to use this feature of the page class:

const puppeteer = require('puppeteer');
puppeteer.launch({ headless: false })
    .then(async (browser) => {
        const page = await browser.newPage();

        //setViewport
        await page.setViewport({ width: 1024, height: 800 });

        //Start Trace
        await page.tracing.start({ path: 'trace.json' });

        //Navigate
        await page.goto('http://www.vistaprint.com', { waitUntil: 'load' });

        //Stop Trace
        await page.tracing.stop();

        browser.close();
        process.exit(0);
})

If aren’t sure how to handle all of the data that the trace produces Google has provided a page that will create a visual representation of everything within the trace file. This page works with raw Gists, a dropbox URL or with Google Drive. Here’s the timeline viewer – it’s very detailed and probably has all of the performance information you’re looking for:

traceview

If you are familiar with handling page trace data and want to get a specific event you can read in the raw tracefile, parse it and manipulate the data however you wish:

 var devToolsEvents = fs.readFileSync(traceFile, 'UTF-8');
            var parsedData = JSON.parse(devToolsEvents);
            var scriptEvals = [];

            for (var i = 0; i < parsedData.traceEvents.length; i++) {
                console.log(parsedData.traceEvents[i]);
                try {
                    if (parsedData.traceEvents[i].name == "EvaluateScript") {
                        scriptEvals.push(parsedData.traceEvents[i]);
                    }
                }
                catch (e) {
                    console.log(e);
                }

In order to get specific events from the browser directly you can create a custom object that contains the data you need:

const firstPaintTime = await page.evaluate(_ => {
            return Object.assign({
                firstPaint: chrome.loadTimes().firstPaintTime * 1000 - performance.timing.navigationStart,
                otherData: <performance data>
            }, window.performance.timing);
        });

The catch here is that you need to know the names of specific events.

One issue with other automation solutions is that it’s not very easy (or possible) to get page performance information. One of Puppeteer’s main draws is that this functionality is built into the API giving users easy access to nearly everything the browser does. If you are on the lookout for a performance testing solution and don’t mind spending some time to understand the trace data Puppeteer may be for you.

Google Chrome Puppeteer – The Basics

As many of you have heard, Google has released their most recent web automation tool called Puppeteer. This Node library uses an API to control Chromium (headless and non-headless) to:

  • Take screenshots
  • Scrape web content
  • Automate web testing
  • Capture performance data using the Chrome DevTools protocol
  • Run tests against the latest version of Chrome/Chromium. Without the ability to test on the latest version of a browser the value of your tests decreases before you’ve even run any tests.

I was very excited to hear about Puppeteer and its list of supported features and couldn’t wait to fire it up and start testing. The first question that popped into my head was “Can this replace my existing UI testing solution (eg: Selenium, Sikuli, Watir, etc)”. The conclusion that I came to after playing around with Puppeteer for a bit was “it depends what you want to do”. What I mean by this is, I don’t think that Puppeteer is going to replace existing mature test frameworks quite yet. However, let’s get into it and you can decide for yourself.

Getting Started

As the Puppeteer Github page indicates, getting started is actually pretty easy. The only requirements are:

    1. Node 7.6.0 or greater (I use it with 8.4.0 and have had no problems)
    2. Run this command which also automatically installs Chromium:
       npm i puppeteer

After Puppeteer is installed, you should be good to go! All you need to do is create a Node project and start testing.

According to the Github page the way to start Puppeteer the way to start the browser is with this code (“headless: false” added to confirm it works):

const puppeteer = require('puppeteer');
(async () => {
    const browser = await puppeteer.launch({ headless: false });
    const page = await browser.newPage();
    await page.goto('https://example.com');
    await browser.close();
})();

Slightly different syntax would be:

const puppeteer = require('puppeteer');
puppeteer.launch({ headless: false })
    .then(async (browser) => {        
        const page = await browser.newPage();
        await page.goto('https://example.com');
        await browser.close();

I’m sure there are other ways to set up Puppeteer syntactically so I would say use your favorite unless you have a compelling reason to use a specific one.

One main benefit of using a recent version of Node is that it allows you to use async/await so that you can avoid chaining promises together. You can still do that if you wish, but I personally like the cleaner async/await format.

Basic Test Features

Now that you’ve gotten started let’s test out some basic test features noted on the site. They are all fairly easy to use and the documentation is mostly accurate.

Navigating

As you can see in the previous examples, navigating is as simple as including:

 await page.goto('http://www.vistaprint.com');

Additionally the API has several options which you can use depending on the purpose of your navigation. These are the most useful:

    • Timeout – waits for a certain number of ms before timing out
    • WaitUntil – considers successful navigation if either “load” is fired or “networkIdle”

Screenshots

Taking a screenshot is one of the easiest things to do using Puppeteer, all you have to do is add this line:

await page.screenshot({ path: 'example.png', fullPage: true });

Adding “{fullPage: true}” will snap the entire page.

One caveat to using the default behavior of page.screenshot is that it defaults to an 800×600 image. For some websites that’s small enough to hit some responsive breakpoints so that may not be ideal. To expand the width of the image you have to change the size of the viewport:

await page.setViewport({ width: 1024, height: 800 });

When using this in non-headless mode the display of the browser is a little odd. The browser itself seems to be set at about 930px and the content inside will scale to be either smaller or larger than the browser depending on the size of the viewport you set.

Default 800px wide with gray gutter:

800gutter

Viewport is larger than the browser’s 930px:

1600nogutter

Screenshot functionality is not affected by this bug, but it’s something to be aware of if you are watching your scripts and notice this odd behavior.

You can also clip the image, change the type, set the quality, alter the path and omit background (which allows capture of windows with transparency).

Manipulating Elements

The keyboard, mouse and focus events are easy to use so I’ll focus on what isn’t as straightforward as copy/paste from the documentation. Clicking elements and selecting element properties are two of the most frequent things an automation script will do. Some of these features are easy to use but others require a little trial and error.

Selecting an element and clicking is one of the easiest commands to execute:

let signInButton = await page.$('.header-link-text-signin')
await signInButton.click();

Since Puppeteer will only wait until the click event is done, not until the next page loads, your best bet is to use this to make the page wait before you continue your verifications:

await page.waitFor('selector')

If you use “page.goto” you have the option of waiting until network traffic is idle, waiting until the load event is fired or waiting until a timeout expires.

Now that you have selected an element you’ll notice that it’s not very useful by itself other than clicking it as it’s an elementHandle. Selecting elements and using their properties is really what we want to do as testers. Puppeteer says that you can get this information from an elementHandle but I have not been able to get this to work:

const bodyHandle = await page.$('.header-link-text-signin');
const html = await page.evaluate(body => body.innerHTML, bodyHandle);
await bodyHandle.dispose();

In order to get innerText or other properties I have used “page.evaluate()” which executes some code in the context of the browser console. I had some trouble with finding out how to do this initially so hopefully these lines can save someone some time:

let signIntext = await page.evaluate(() => document.querySelector('.header-link-text-signin').textContent); 
let signInText= await page.evaluate("$('.header-link-text-signin').text()"); 
let signIntext = await page.evaluate(function () {
            return $('.header-link-text-signin').text();
        });
 let signInText = await page.$eval('.header-link-text-signin', function (text) {
            return text.innerText;
        });

There are definitely other ways to do this so it depends on how much you want to spend investigating. Rinse and repeat for anything else you wish to grab from page elements for your test verifications.

Tying the Basics Together

At the end of the day, the only thing that really matters is whether or not you can automate the things that you need to test. Here’s an example that uses the functionality I’ve reviewed to show what the beginning of a test may look like:

const puppeteer = require('puppeteer');

puppeteer.launch({ headless: false })
    .then(async (browser) => {
        const page = await browser.newPage();

        //setViewport
        await page.setViewport({ width: 1024, height: 800 });

        //Navigate
        await page.goto('http://www.vistaprint.com', { waitUntil: "networkidle" });

        //Scrape urls that contain certain text        
        let links = await page.evaluate(function () {
            return [].map.call(document.querySelectorAll('[href*="/business-cards/"]'), function (link) {
                return link.getAttribute('href');
            });
        });

        //Navigate to links and take a screenshot of each page
        for (i = 0; i < links.length; i++) {
            await page.goto('http://www.vistaprint.com' + links[i], { waitUntil: "networkidle" });
            await page.screenshot({ path: 'example' + i + '.png', fullPage: true });
        } 
        await browser.close();
    })

With this code as the base you could hook up an image comparison tool and have a quick and easy image comparison test.

Final Thoughts

While Puppeteer does give you the ability to control most aspects of the browser I did have some trouble using some “out of the box” features of the API. For example, accessing cookies did not work properly before version 10.2. Another issue I ran into was with screenshots (detailed in a previous section. Other issues can be found on the Puppeteer team’s issues Github page.

One really cool feature is the ability to create a trace log of all page activity. For anyone who has wanted access to the Chrome DevTools data this is very useful. Another neat feature is easy access to page requests and responses which can be challenging to test.

While the Puppeteer API has a lot of great features you will need to either wait on the community to add support for a test runner or build your own. Overall, I would say that Puppeteer is a great testing tool that can do just about everything existing frameworks can do. At the moment I would recommend holding off on switching over to Puppeteer until some quality of life extensions have been built. Once the community has had time to build around Puppeteer and some of the existing bugs are fixed, I see no reason why someone wouldn’t want to use it.